Road Safety: Predictive models 3x more efficient vs. analysis of the past?
Data can accelerate a different future for #roadsafety. Vehicle data are collected 24/7 across the world. These trillions of datapoints, once translated into Mobility and Safety Insights, can help highways managers to implement predictive road management. This extensive UK study shows an efficiency improvement with a factor of 3.23 versus traditional retroactive analysis of the past via historical collision tracking.
In this second decade of action towards #VisionZero, data are readily available for road operators and municipalities to implement more prioritised and context-specific infrastructure work, thus avoiding allocating public resources blindly.
Since 2018, sensors are mandatory in new passenger vehicles. A modern car can contain up to 400 sensors. Vehicles have become a ubiquitous fleet of mobile trackers closely monitoring the road environment. A sea of inspectors, hundreds of thousands of road radars are checking all road sections in your area 24/7, whatever the weather, whether it is daytime, weekend or the middle of August.
These vehicle data represent an untapped data mine for road engineers who oversee road quality and safety. To validate the efficiency of these data insights, a large study was conducted in South-East England.
From 15 to 18 October 2024, in Istanbul, industry leaders, policymakers, and experts will converge to share insights, discuss trends, and showcase innovations shaping the future of road mobility.
- Goal: compare the predictive efficiency of 2 types of datasets: Can future crashes be predicted more accurately using connected vehicle data or looking at past collisions?
- Methodology:
- 3 months of vehicle data: 15 303 harsh braking clusters (first quarter of 2022)
- 100,000 km of road sections in South-East England, area of more than 60 counties
- 2 million harsh braking events
- 6.2 million vehicle traces
- total represents 134 million hours of driving
- Historical dataset: 263 455 events with Killed or Seriously Injured (KSI) over 5 years (2017 – 2021)
- 3 months of vehicle data: 15 303 harsh braking clusters (first quarter of 2022)
- Key results:
- A prioritised map of hotspots where collective abnormal driving behaviour (harsh braking events) have been observed. These events are a lead indicator of dangerous locations, according to the scientific literature. The RoadTrace™ algorithm uses these predictors to anticipate future collision locations, considering a severity factor for each harsh braking event (depends on frequency, acceleration and speed).
- Behavioural data improve collision prediction efficiency with a factor of 3,23 (vs. historical analysis of 5 years crashes). Not taking into account these available data now leads to extra budget spent.
Vehicle data could form an efficient basis to:
- Understand context and actual road behaviour in a variety of conditions.
- Rank risks identifying highly specific contexts enables prioritisation of infrastructure work. Hotspots that represent the biggest road safety risk can be tackled first. A key advantage when budgets are short and not all maintenance work can be implemented at once.
- Switch road management decisions from reactive to proactive: vehicle dataare the key ingredient that allows councils and cities to shift to Road Management 4.0. Leveraging technology is enabling decision-makers to make informed decisions about their network, anticipating future collisions.
A key step for road safety decision makers to unlock a step change towards #VisionZero.


Thursday 10 Oct – 13.00 CET!
Latest News
- MoU signing between IRF and VRCIC to Advance Cooperative Vehicle-Infrastructure Technologies

- IRF and CHTS Strengthen Collaboration in Advancing Research in Autonomous Vehicles
- Driving Innovation: IRF and CHTS Strengthen Collaboration in Smart Mobility Research
- Hi-Drive Webinar Explores the Technology Enablers for Higher Vehicle Automation
- Introducing the IRF Start-Up 2025 Finalists
- Building Resilient Roads for a Safer and Connected Future


MORE NEWS

0 Comments7 Minutes
From intrapreneurial initiative to independent start-up: ORIS Materials Intelligence accelerates its development
ORIS adopts a new shareholding structure around its co-founders, with the entry of a new strategic investor, LIBERSET.
0 Comments3 Minutes
TRL Software Launches SCOOT® 8 AI
World's First AI-Powered Predictive Urban Traffic Control Solution
0 Comments5 Minutes
Milton Keynes City Council selects TRL Software’s UTC powered by SCOOT®
The TRL Software will be used to manage the growing city’s traffic network
0 Comments6 Minutes
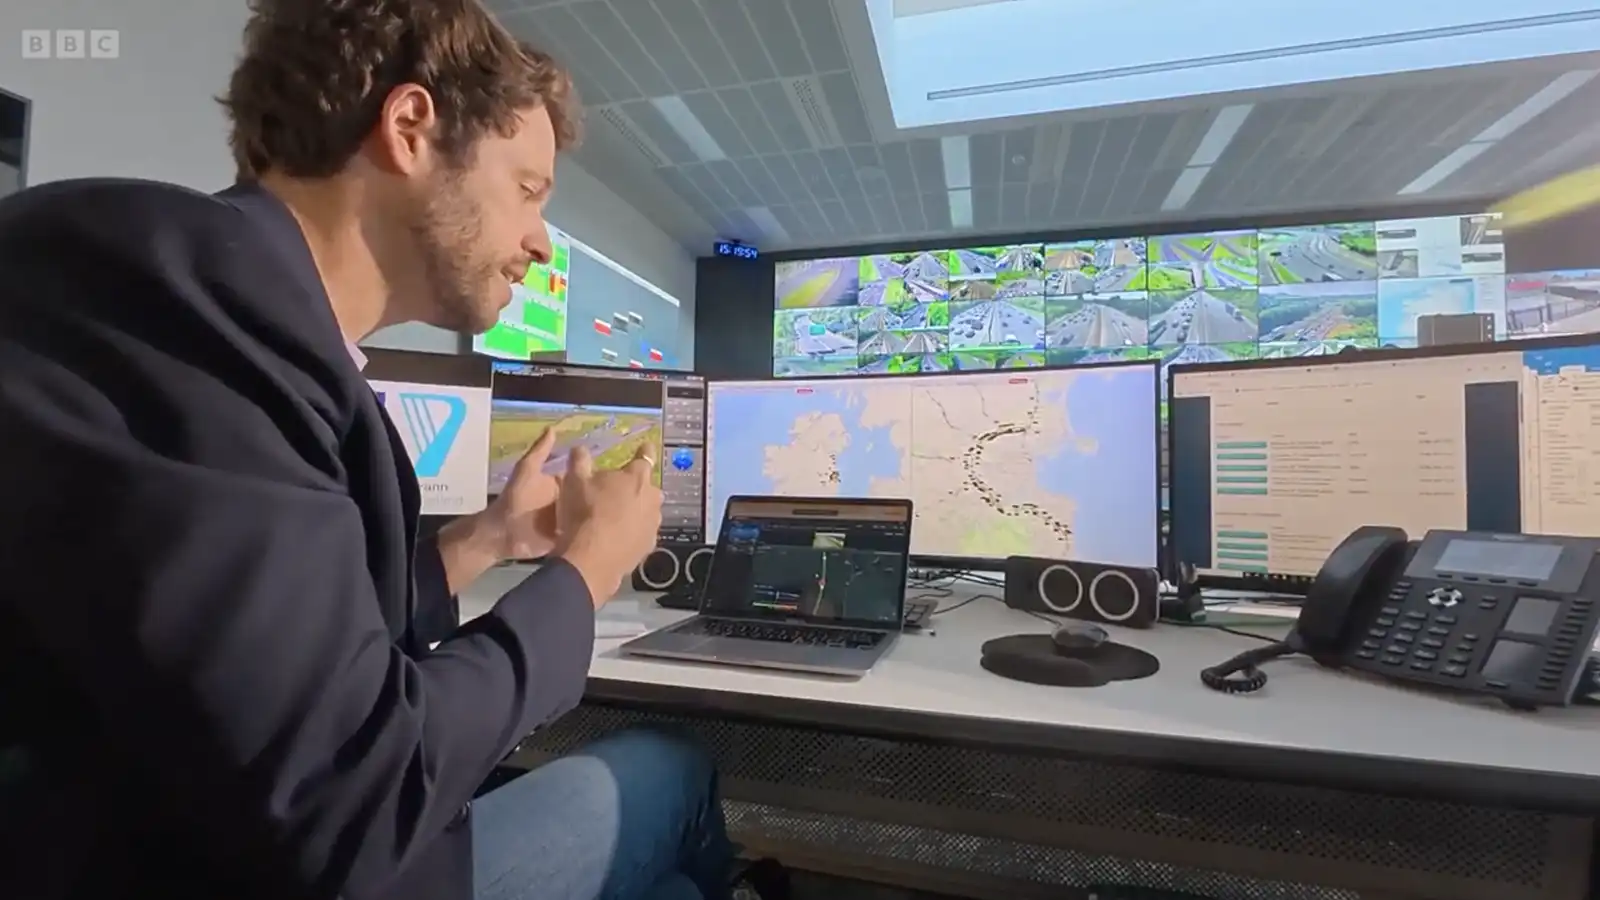
BBC Tech Now features Valerann
Valerann discusses features of its Motorway Operations Control Centre with BBC.
0 Comments4 Minutes
Valerann Wins 2025 IBTTA Toll Excellence Award
Valerann was awarded for Transforming Incident Detection and Response on Ireland’s Road Network with AI-Powered Data Fusion